TL;DR
Search analytics connects what shoppers type into your search bar to what they buy, using KPIs like zero-result rate, search exit rate, and revenue per search user. Voyado sees the same gap across retail: search drives your best sessions, yet your dashboards report “search sessions” as traffic, not revenue. Each insight maps to a fix and a revenue number, and that’s how H&M cut zero-hit search by 50% with richer ranking signals.
Search often drives your best sessions, yet most teams track it with one basic event and never tie it to revenue. Search analytics is the missing layer that connects what shoppers type into your internal site search bar to what they buy. This KPI framework, built for UK and EU retailers, ties each insight to a fix and a revenue number and shows you where to optimize first.
What site search analytics tells you that GA4 alone does not
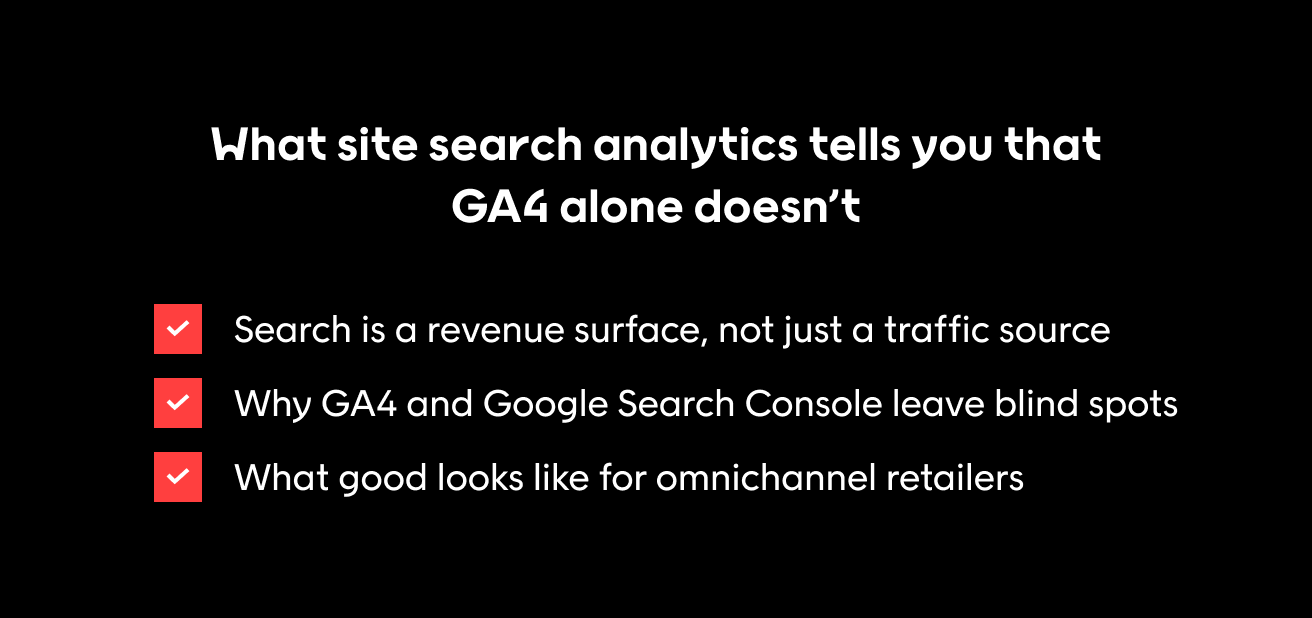
Site search analytics measures what shoppers type into your own search bar and what happens next on your website. It’s separate from search engine optimization (SEO), paid search, and Google Search Console, which track how people search on external search engines. The question it answers: which queries converted, failed, or leaked revenue?
Search is a revenue surface, not just a traffic source
Voyado treats zero results, weak relevance, and poor refinement as quiet revenue loss hiding behind “search sessions.” Shoppers who use your search function arrive with clear user intent, so a broken search process costs more than a failed browse. The zero-result rate pinpoints broken queries, and the search exit rate flags poor relevance. H&M cut zero-hit search by 50% with richer ranking signals.
Why GA4 and Google Search Console leave blind spots
Google Analytics 4 (GA4) and Search Console each cover part of the picture, and most website owners stop there.
| Tool | What it covers | What it misses |
| GA4 | Search events and the common queries in its search term report | Joins queries to purchases, stock, and margin |
| Search Console | Queries and organic traffic from Google, for your SEO efforts | Anything that happens in your own search bar |
With internal site search analytics, Voyado adds margin mix and search vs. non-search conversion to show which queries cost you sales in each market.
What good looks like for omnichannel retailers
Voyado powers 5 million searches daily across 500+ retail brands. Good means tying query outcomes to product data, local stock, customer context, and in-store orders, so your site’s search experience becomes e-commerce product discovery rather than a lookup box. Norwegian retailer Obs/Obs Bygg combined offline transactions with real-time user behavior and grew search revenue by 4.5%.
8 search analytics KPIs that connect search to revenue
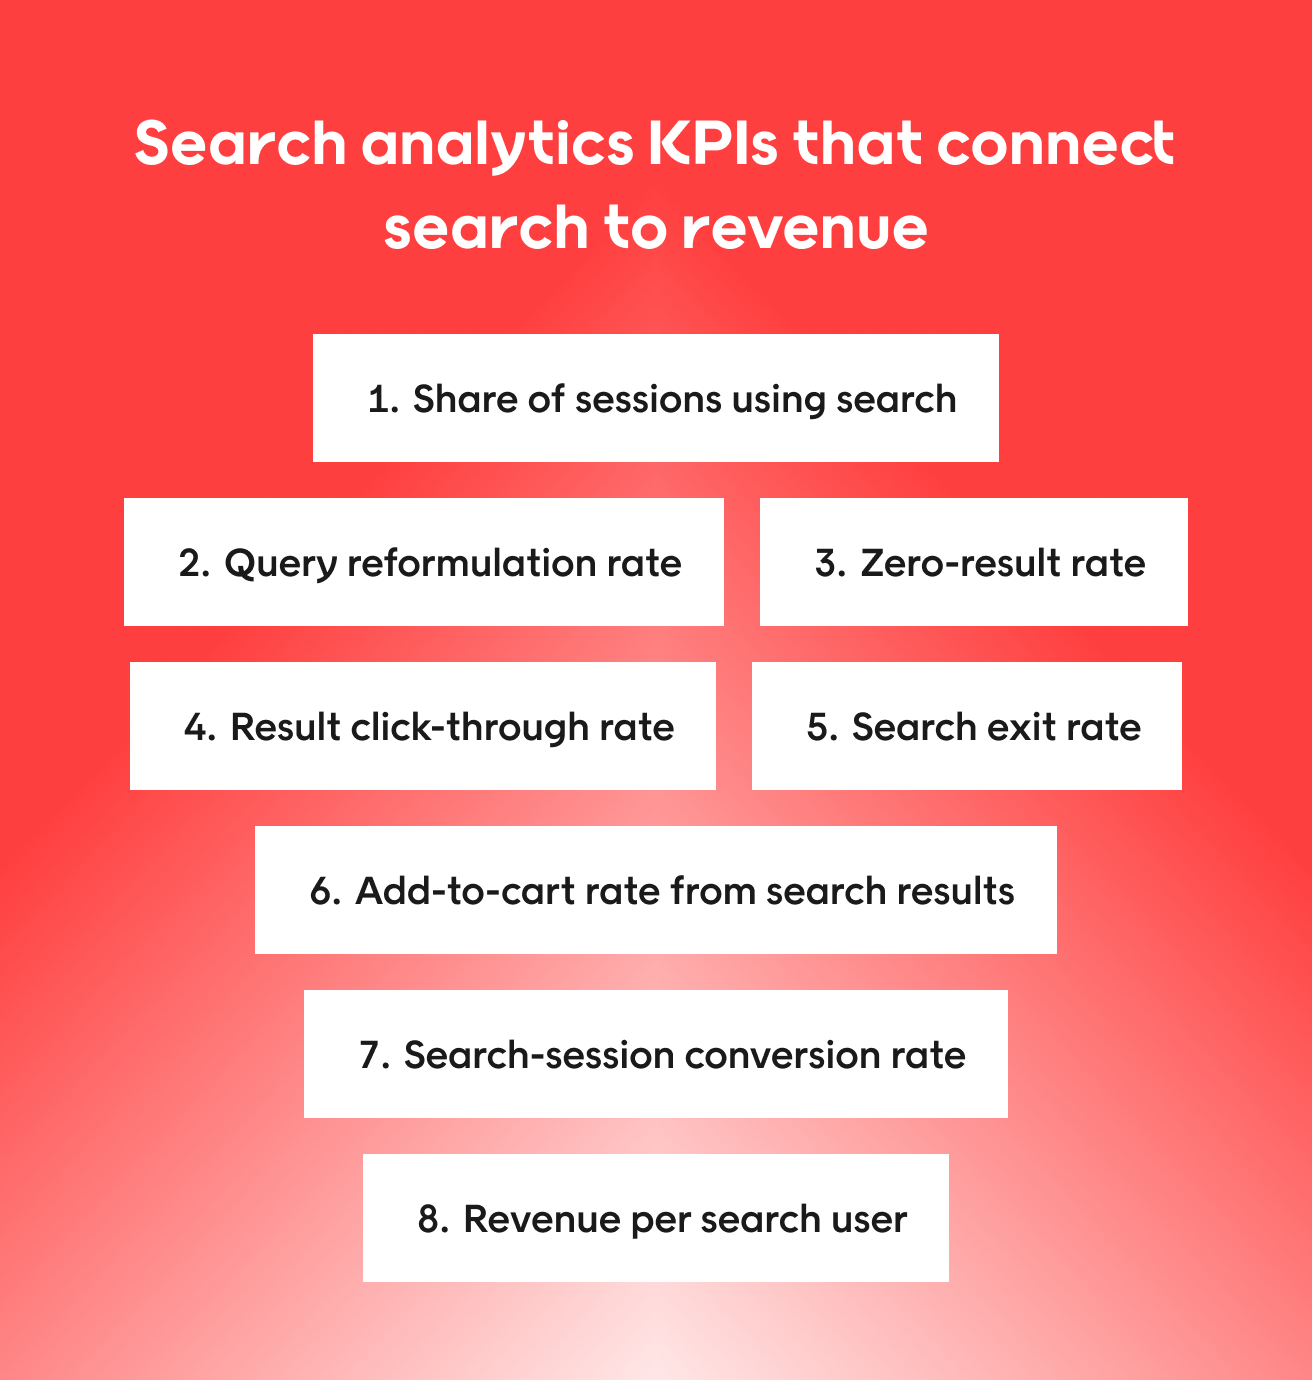
Search analytics pays off when every KPI names its denominator, commercial meaning, and fix. These eight KPIs are the key components of a revenue-linked view of search behavior.
| KPI | Formula/denominator | Why it matters | Action it triggers |
| Share of sessions using search | Search sessions ÷ sessions | Discovery dependence | Prioritize search |
| Query reformulation rate | Reworded queries ÷ queries | Weak relevance warning | Add synonyms |
| Zero-result rate | Empty queries ÷ queries | Broken demand capture | Add fallbacks |
| Result CTR | Clicks ÷ result impressions | Ranking and data quality | Enrich attributes |
| Search exit rate | Exits ÷ result views | No compelling next step | Standardize filters |
| Add-to-cart rate from search | Search adds ÷ search sessions | Intent becoming action | Rank in-stock first |
| Search-session conversion rate | Orders ÷ search sessions | Search vs non-search | A/B test ranking |
| Revenue per search user | Revenue ÷ search users | Search tied to money | Check margin mix |
Usage and intent KPIs
Pair these with top-queries reporting and search volume per term to fix high-demand terms first.
1. Share of sessions using search
Share of sessions using search divides search sessions by all sessions, showing how much discovery runs through your search feature. Action: treat a higher share as a bigger revenue priority.
2. Query reformulation rate
Query reformulation rate tracks how often shoppers reword or repeat a query, an early sign that results miss user needs or synonyms. Action: add synonyms, redirects, fallback logic, or semantic search.
Result quality and friction KPIs
Every unmatched intent is lost revenue, so Voyado shows what shoppers want, not just what they typed.
3. Zero-result rate
Zero-result rate is the share of queries that return nothing. It’s the clearest sign of broken demand capture and the fastest way to spot content gaps in your catalog. H&M halved theirs with richer ranking signals.
4. Result click-through rate
Click-through rate (CTR) divides clicks by impressions; low scores indicate weak ranking or thin product descriptions. Voyado enriches attributes with Product AI.
5. Search exit rate
Search exit rate is the share of shoppers who leave from the search results page, and little time spent there means shoppers couldn’t easily find a next step. Action: keep faceted search filters like size, color, brand, and price consistent, allowing users to narrow results fast.
Commercial impact KPIs
Treat commercial KPIs as directional, since search users often convert better anyway. Voyado proves ROI by A/B testing ranking on incremental revenue, conversion uplift, average order value (AOV), and margin.
6. Add-to-cart rate from search results
Add-to-cart rate from search counts adds after a search-result interaction, showing whether relevant products move shoppers to act. Action: rank in-stock, locally available items first.
7. Search-session conversion rate
Search-session conversion rate is orders divided by sessions that used search. Compare it with non-search sessions to see whether search helps drive conversions, since the gap alone doesn’t prove causation.
8. Revenue per search user
Revenue per search user is revenue divided by unique search users. Review it alongside margin mix so ranking grows profit, not just volume. Voyado customers average a 15-20% conversion uplift, not a guaranteed one.
How to instrument internal site search analytics end to end
Search analytics only works when one stitched journey runs from query to purchase. Here’s the implementation model Voyado uses. Keep data collection to what consent allows under the UK General Data Protection Regulation (UK GDPR) and the Privacy and Electronic Communications Regulations (PECR).
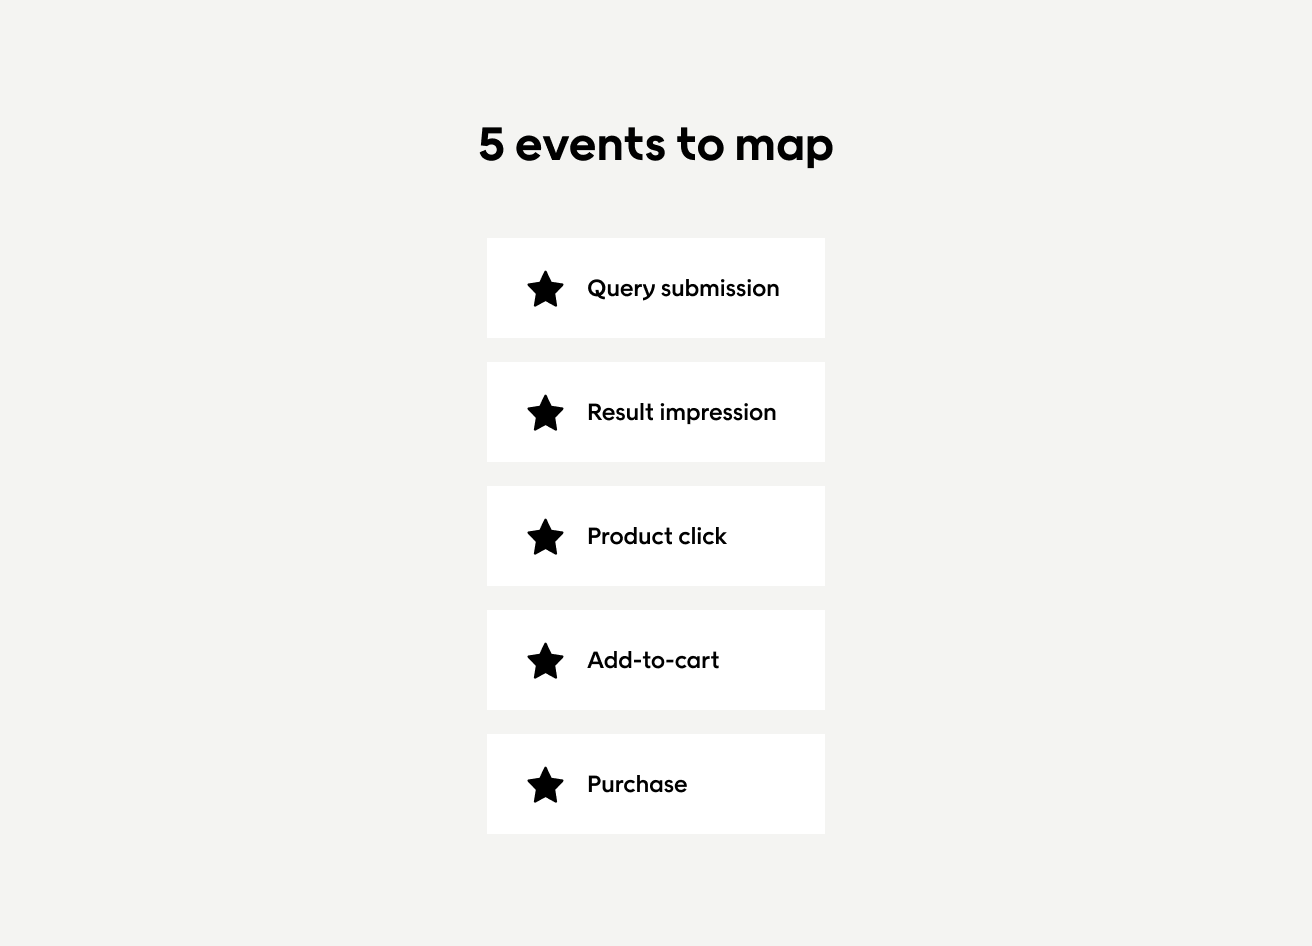
Map the 5 events that matter
Every event shares one journey ID, so your site search data reads as one story.
1. Query submission
Capture raw query, timestamp, market, language, device, and a consent-safe ID.
2. Result impression
Record what was shown, in what order, and under which search settings or ranking rules.
3. Product click
Track the clicked stock keeping unit (SKU) or variant.
4. Add-to-cart
Tie adds to the originating search and result set.
5. Purchase
Join orders to search for revenue and margin by query.
Use stable IDs to stitch the journey
Voyado joins four IDs to stitch each journey:
- Search ID links a query to the results it returned.
- Session ID links the search to the wider visit.
- Product ID links clicks and orders to stock and margin.
- Customer ID links the journey to loyalty and purchase history.
Without them, revenue floats free of the query, and your search data can’t join to other systems like loyalty or point of sale. Unified profiles helped Obs/Obs Bygg lift search revenue 4.5% and feed their wider marketing efforts.
Measure typed and conversational search in the same model
Voyado measures keyword and conversational search in one schema that covers intent, suggestions, refinements, and actions, so you understand user intent however shoppers phrase it. Agentic discovery shows why it matters:
- 2x add-to-cart rates
- A 50% increase in engagement
- 85% interaction
Know where GA4 ends, and your search platform or warehouse begins
- GA4 handles collection and broad reporting.
- Your site search platform runs query diagnostics and A/B testing.
- Warehouse joins power stock- and margin-aware analysis.
How to fix zero-result and low-converting queries with retail context
Search analytics pays off when each query signal has a fix, an owner, and a revenue number. Retail context, not generic AI, makes fixes convert because it knows which relevant search results can actually sell.
Separate catalog gaps from relevance problems
Voyado checks product taxonomy, attributes, variants, seasonality, newness, and local assortment to separate missing stock from misread user intent. Start with zero-result rate, then check whether the query has relevant content or products anywhere on site.
Use stock, variants, and margin to rank what can actually sell
Out-of-stock or margin-eroding results aren’t relevant results. Voyado ranks by local availability and boosts high-margin SKUs, so the most relevant search results match the shopper and the shelf.
Fix high-intent leaks with search merchandising
These searchandising fixes fine-tune your site search functionality without a rebuild:
- Synonyms, like “jumper” for “sweater”
- Redirects for brand queries
- Curated pages that send “gift,” “sale,” or “wedding” queries to specific content
- Fallback logic for near misses
- Consistent facets
- Query-level boosts or exclusions
Example: Obs/Obs Bygg connected search to retail context and saw a 4.5% increase in revenue from search.
Run a weekly workflow to prioritize fixes
Owners are the Merchandising team, E-commerce Manager, and Product data owner. Each fix passes stock, margin, and relevance checks before shipping, so resources go to changes that can sell.
Find the biggest revenue leaks
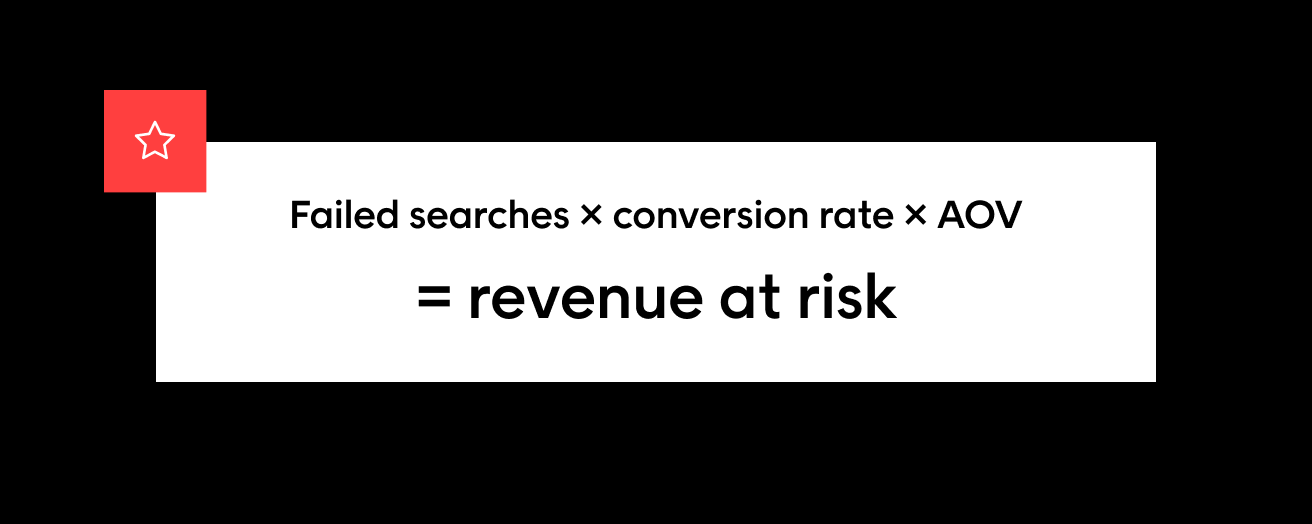
Rank zero-result, high-exit, and low-converting queries by revenue at risk, not search volume:
Failed searches × conversion rate × AOV = revenue at risk
For example, 1,000 failed searches at 2% conversion and £80.00 AOV puts £1,600.00 at stake.
Diagnose the root cause
Work through the likely causes:
- Product descriptions and attributes
- Synonyms
- Ranking
- Stock
- Facets
- Localization and content
- Search trends, like seasonal spikes
Then label it a demand, discovery, or availability problem.
Ship the fix and test the lift
A/B test each change against one outcome and log it against the owner. Over time, the log surfaces new insights into which fixes pay off.
How to segment site search analytics by market, stock, and customer
Segmented search analytics exposes the leaks one global average hides. Even a single website serving several markets needs zero-result rate and search exit rate tracked per segment.
Start with market, language, currency, and assortment splits
Compare “trainers” at £90.00 on your UK site with “Turnschuhe” at €105.00 on your German site. Voyado uses real-time stock and localization to separate translation issues from regional search trends and return accurate results in each language.
Compare new, returning, and loyalty cohorts
Does a query convert differently for first-time visitors and loyalty members? Voyado personalizes by cohort and geo to increase average order value and repeat purchases, turning search behavior into customer insights for loyalty and campaigns.
Keep UK and EU privacy rules in view
Query data falls under the EU General Data Protection Regulation (GDPR), UK GDPR, PECR, and the EU ePrivacy Directive. Flag consent gaps in reports and get legal review before changing data collection.
Redact accidental personal data in queries
Shoppers type names, emails, or addresses into search, so mask them before analysis to keep search data clean.
Set retention and access controls
Limit raw-log retention and access, and keep aggregated KPIs for trends.
What to look for in a site search analytics setup
Judge any site search analytics setup by what retail teams can act on. Skip the feature parade: the right site search solution shows which queries earn and which leak.
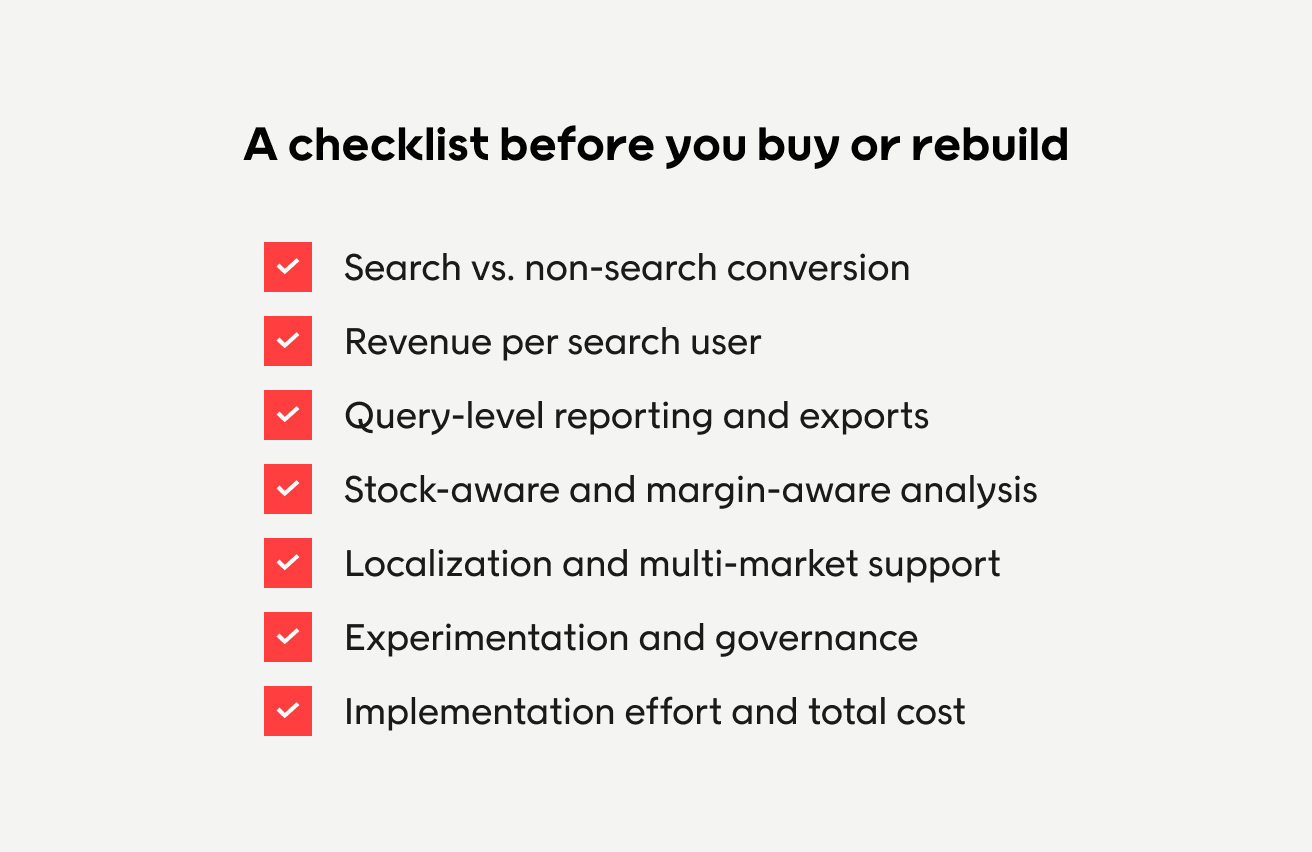
Use a 5-point checklist before you buy or rebuild
Start with two KPIs any setup should report out of the box:
- Search vs. non-search conversion
- Revenue per search user
Then check the five capabilities below.
1. Query-level reporting and exports
Require queries, result sets, clicks, exits, purchases, and warehouse exports, so internal site search analytics goes beyond GA4.
2. Stock-aware and margin-aware analysis
Separate relevance from availability and profit, with real-time stock context built in, so relevant products that can’t ship don’t rank.
3. Localization and multi-market support
Require market-specific language, £ and € currency, and assortment, so shoppers get relevant information in their own language.
4. Experimentation and governance
Prioritize built-in A/B testing, access controls, and consent-safe handling.
5. Implementation effort and total cost
Weigh manual tuning, engineering, and maintenance in the business case, plus how the search functionality connects to other systems like your product information management (PIM) and loyalty platform.
Why retail context changes the value of the data
The best setup understands products, variants, stock, and merchandising priorities. Unlike search on content-heavy websites, retail search has to rank what can actually ship. Effective site search on an e-commerce site means a better user experience and more revenue per query. Voyado builds that in and delivers personalization at scale without manual tuning.
Final thoughts
Search analytics answers “search drives our best sessions, but I barely measure it” with a KPI framework, not more dashboards. Every zero-result or low-conversion insight points to a fix and a revenue number. Obs/Obs Bygg proved the link between search and revenue with Voyado Product Discovery, growing revenue from search by 4.5%. A better search experience also lifts overall customer satisfaction.
Retailers with 1M+ monthly sessions can start with a free product discovery audit.
FAQs
Is Google Search analytics free?
Yes, but Search Console reports on external search engines and GA4 on broad traffic. Neither shows zero-result rate or revenue per search user for your own search bar.
How do I see Google Search analytics?
Search Console’s Performance report shows organic traffic from Google, and GA4’s Reports section shows behavior on your website, but on-site search needs dedicated search analytics.
Is Google Analytics an SEO tool?
No, but GA4 supports SEO efforts by measuring behavior after users arrive. It doesn’t audit rankings or diagnose failing on-site queries, which need internal site search analytics.
Which KPIs should we look for in a search analytics tool to connect on-site search to revenue and margin, rather than just clicks?
A search analytics tool should report search share, conversion vs. non-search, revenue per search user, zero-result rate, exit rate, and top queries. Margin mix, stock awareness, and query-level exports set the strongest site search platform apart.
What would dedicated search analytics tell us about sales performance that we can't already get from GA4?
GA4 reports search sessions, while dedicated tools expose zero results, stock misses, and query-level revenue from your site search data, which helped H&M halve zero-hit search.
How can we test whether better search actually increases revenue, rather than just attracting shoppers who were already more likely to buy?
Search users convert better anyway, so prove lift with A/B tests, matched cohorts, or pre/post analysis on incremental revenue. That separates what search adds from existing user intent.
Can search analytics show which queries are costing us the most sales in each market, including searches that return products but don't lead to purchases?
Yes, if search analytics joins queries to clicks, exits, conversions, revenue, and assortment per market, including relevant results that never convert. That gives fixes like synonyms a revenue number.