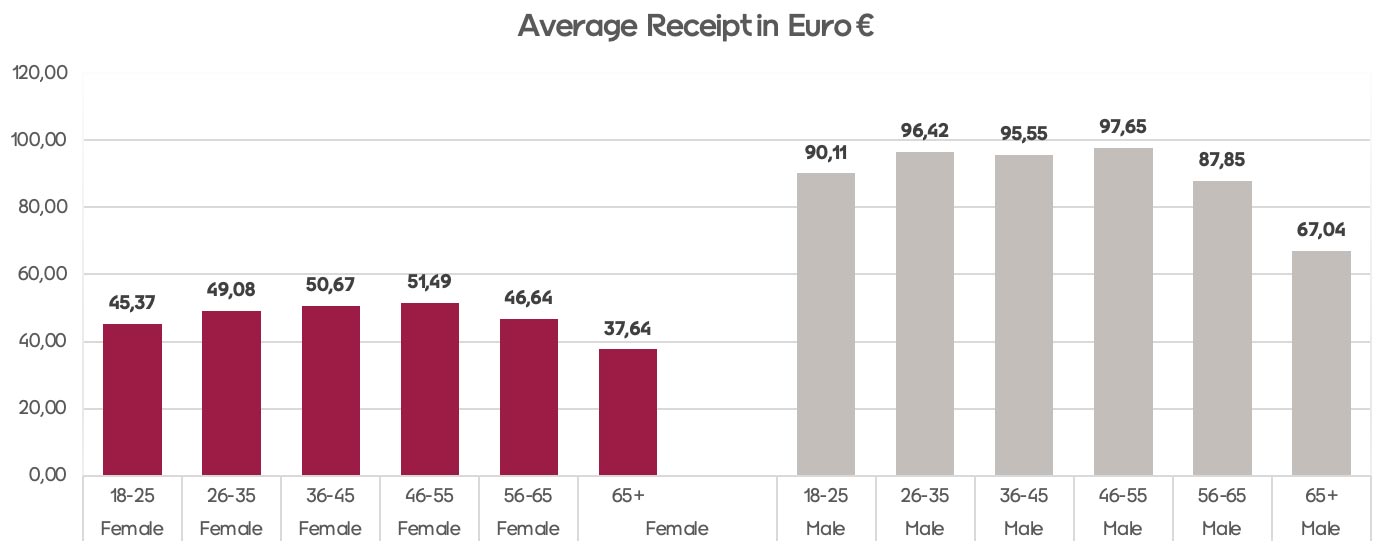
Who has the highest average receipt value?
If we were to ask you to guess which age range has the highest average receipt value in DIY and Home Improvement, what would you say? Would you wager a bet on the youngsters or those pushing retirement? We have gathered data on millions of transactions for Voyado’s customers and gained some interesting insights into these stats. Surprisingly, it turns out it is the young ones who spend the most (on average).
Which industry has the highest average purchase per member?
Would you have guessed that the average purchase per member in Health and Beauty is almost double than in DIY and Home Improvement or Fashion? That’s just one of the interesting stats that came to light when we aggregated data from all our clients for 2022.
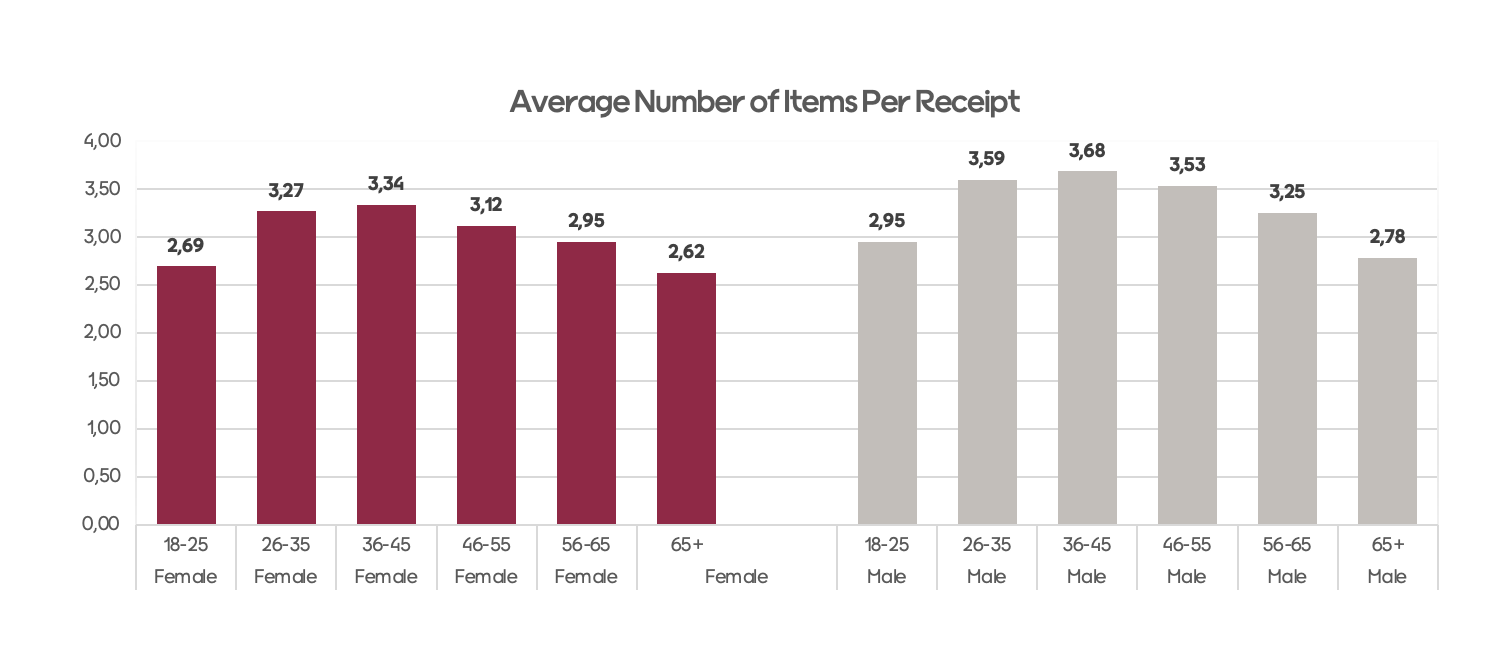
With the right customer data platform, you can keep an eye on these metrics and deploy various tactics to see if your brand can see a measured increase in the stats over time following various initiatives. For example, you might want to focus on upselling at checkout to see if you can impact the average purchase per member data for your brand.
Who loves abandoned cart emails the most?
Here’s another one: would you have guessed that the abandoned cart click rate goes up by age category or down? It turns out, the older you are, the more likely you are to click on such an email.
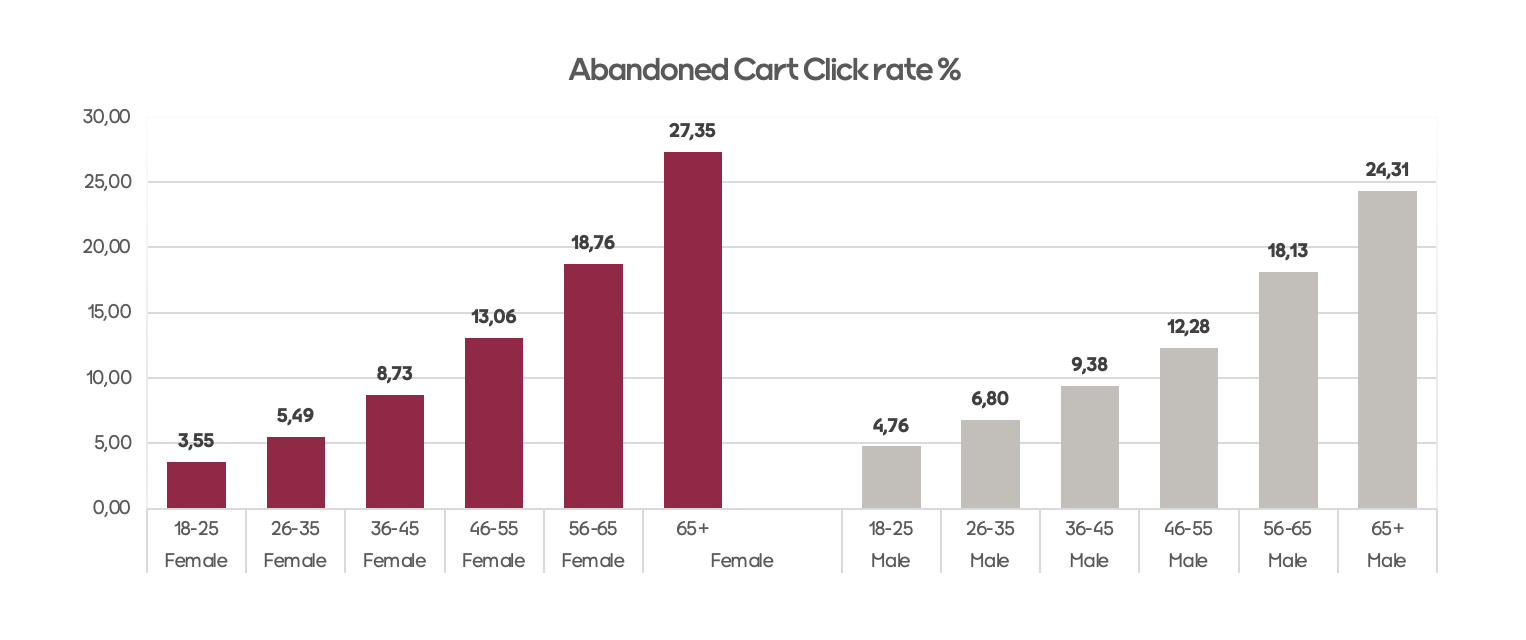
Abandoned cart automations are easy to set up, and once the automation is running, it will continue to do the work with zero input from the team. This kind of automation can have a significant impact on sales for your company, especially if targeted towards those most likely to open the mail.

See how your data compares!
We can see some significant patterns developing in the data, and we’ll bet you can’t wait to see where your stats land – are they way over average, way below, or somewhere in the middle? Get your team together to look over the results and see if it sparks some inspiration.
There are countless ways to improve the stats for your business, from hyper-personalized campaigns to loyalty schemes to automated emails, and all of these opportunities are at your fingertips in a customer data platform.
Discover even more data
If you want access to lots of additional data, download the Voyado Index 2022, which is packed with fascinating data from more than 164 million purchase occasions in 2022.