TL;DR
Knowing how to calculate same-store sales starts with comparing revenue from the same group of stores over the same period, typically locations that have been open for at least a year. Also known as comparable store sales or comp store sales, this metric removes the impact of new openings and closures so you can measure true organic growth.
The same store sales formula is simple. Achieving an accurate same-store sales calculation is not. Reliable results depend on clean POS data, consistent store eligibility rules, and unified transaction data across every channel.
This guide explains how to calculate same-store sales growth, apply the formula correctly, avoid common reporting mistakes, and handle edge cases that can distort your numbers.
What same-store sales actually measure and why it matters
Same-store sales measure revenue generated by the same group of existing stores over the same period, usually locations that have been open for at least a year. It shows whether your existing store base is delivering real growth without the impact of new store openings, closures, or acquisitions.
Why it matters
Same-store sales is one of retail’s most important financial metrics because it reveals organic growth that total sales alone can hide. It helps retail managers decide which stores deserve investment, where expansion makes sense, and which locations need attention before performance declines further.
Understanding the metric is only the first step. Next, let’s look at the formula and how to calculate same-store sales accurately.
The same store sales formula
The same-store sales formula is simple. Accurate results depend on comparing the right stores over the right period using consistent sales data.
Basic same-store sales growth formula
The standard same-store sales growth formula is:
Same-Store Sales Growth (%) = [(Current Period SSS − Prior Period SSS) ÷ Prior Period SSS] × 100
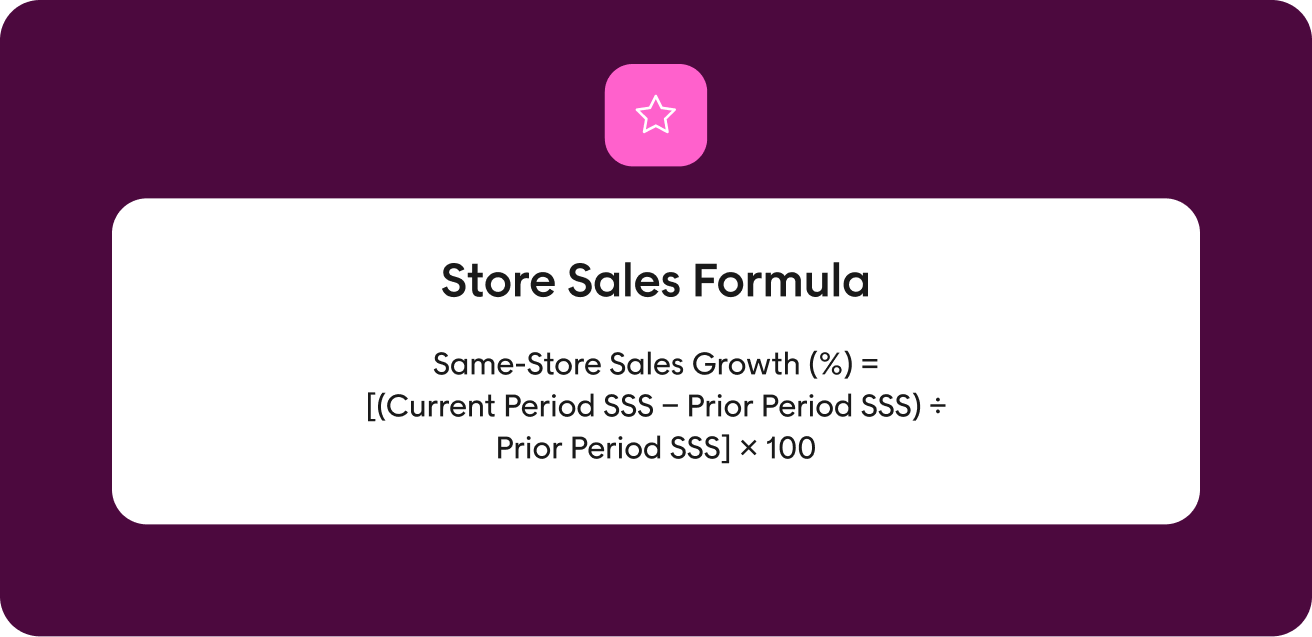
Where:
- Current Period SSS = Total revenue generated by eligible comparable stores during the current period
- Prior Period SSS = Total revenue generated by the same eligible stores during the comparable prior-year period
The result is a percentage showing whether comparable store sales are growing or declining. Because it excludes new store openings and closures, it gives retail companies a clearer view of organic growth than total sales.
Why it matters
The formula is easy. A reliable same-store sales calculation depends on consistent store eligibility, reporting periods, and sales data.
Otherwise, your same-store sales figure can be misleading. That’s why effectively measuring and using accurate retail data matters.
Worked example
A retail chain has 50 comparable stores.
- Current period sales (Q2 2025): $12.5 million
- Prior period sales (Q2 2024): $11.8 million
Same-Store Sales Growth (%) = [($12.5M − $11.8M) ÷ $11.8M] × 100 = 5.9%
The company’s same-store sales grew 5.9% year over year. Excluding revenue from new stores and new locations gives a more accurate picture of store performance and sales growth.
What this means for you
Positive same-store sales growth shows existing locations are generating more revenue than they did in the previous year.
Combined with retail location analytics, it helps identify successful stores, underperforming stores, and investment opportunities.
Monthly, quarterly, and annual same-store sales
You can calculate same-store sales for any given period if you compare like for like.
- Monthly: Best for customer traffic and market trends.
- Quarterly: The standard for retail performance reporting.
- Annual: Best for long-term revenue growth and the company’s organic growth.
Always compare the current period with the equivalent prior-year period to avoid seasonal distortion.
Why consistency matters
Reliable comp sales require consistent reporting across every store location and channel. A unified omnichannel retail platform helps ensure every eligible transaction is counted the same way, creating a trustworthy same-store sales metric.
But the formula only works if you’re comparing the right stores. Next, let’s define which stores qualify for inclusion.
How to define which stores qualify
This is where most same-store sales inaccuracies begin. The formula is simple. Defining the comparable store base is not.
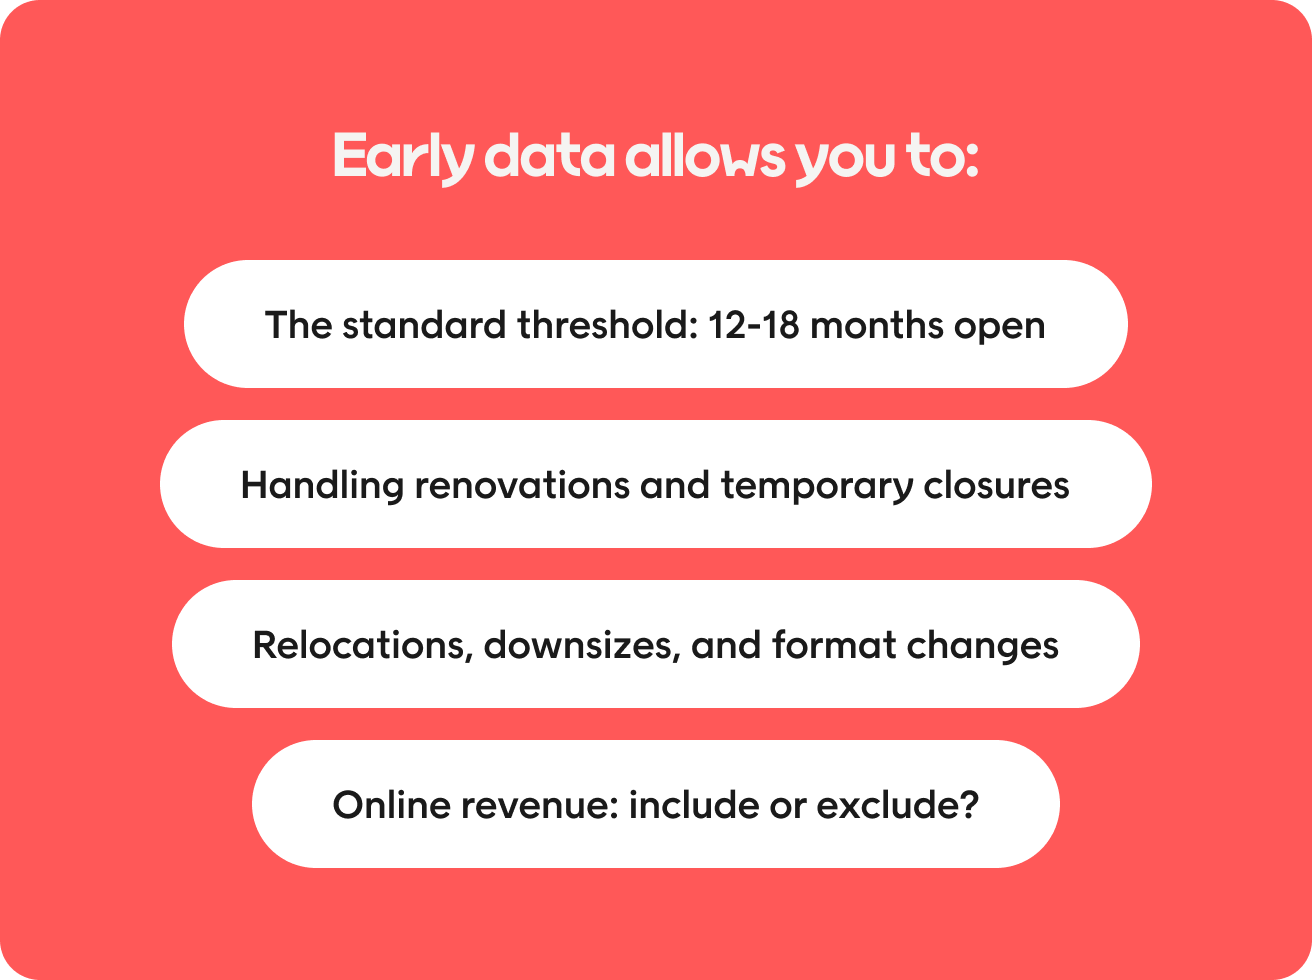
The standard threshold: 12-18 months open
Most retail companies define comparable stores as locations that have been open for at least 12 full months. Some use 13 or 18 months.
The goal is to let each store complete a full seasonal cycle before it enters the same-store sales metric.
Why it matters
If you include new stores too early, you risk overstating sales growth.
Keep the eligibility rule consistent across every reporting period so store performance remains comparable over time.
Handling renovations and temporary closures
Major disruptions should temporarily remove stores from the comparable base. That typically includes:
- Major renovations
- Temporary closures
- Significant format changes
Many retailers also wait another six to 12 months after reopening before including the store again.
If the renovation changes the store’s size or trade area, treat it as a new store for same-store sales data.
Relocations, downsizes, and format changes
A relocated store should usually complete a full reporting period before re-entering the comparable base.
The same applies to:
- Major downsizes
- Format conversions
- Long-term closures caused by construction, natural disasters, or public health events
Why it matters
The goal isn’t to improve the numbers. It’s to make the same-store sales calculation consistent enough to support better decision-making across your retail chain.
Online revenue: include or exclude?
There isn’t a universal standard.
Some retailers include only physical store sales.
Others also include digital sales tied to a store, such as:
- Click-and-collect
- Ship-from-store
- Local delivery
The retail industry is increasingly moving toward comparable sales that include omnichannel revenue. That only works if online purchases can be accurately attributed to individual store locations.
What this means for you
Pick one methodology and stick with it. If your retail business operates across channels, a customer loyalty platform helps connect customers and purchases to the right stores.
Even with clear eligibility rules, small data and reporting mistakes can still distort your results. Let’s look at the most common ones to avoid.
5 common mistakes that make same-store sales inaccurate
Even a correct formula can produce the wrong answer. These are the five mistakes that most often distort same-store sales and make trend analysis unreliable.
1. Inconsistent store eligibility definitions
Your comparable stores should be defined once and kept consistent.
Changing which existing stores qualify or applying the rules differently between reporting periods introduces noise that makes the same-store sales metric unreliable.
Why consistency matters
Lock the definition and apply it uniformly. Consistent rules produce a more reliable sales figure and make store sales growth easier to compare over time.
2. Dirty or fragmented POS data
Accurate same-store sales data starts with accurate transaction data.
If sales data is incomplete, duplicated, delayed, or spread across multiple POS systems, your store sales calculation will be wrong before you even apply the formula.
This is especially common for retail companies operating across regions, brands, or store formats.
The impact on accuracy
A unified data foundation improves reporting accuracy and operational efficiency. Instead of combining spreadsheets from multiple systems, retailers can work from a single source of truth for every store. That leads to more reliable reporting and stronger data analytics.
3. Ignoring currency and inflation effects
Retail chains operating in multiple countries should report same-store sales growth in both local and constant currency.
Inflation creates a similar challenge. Positive same-store sales may simply reflect higher prices rather than stronger demand or revenue growth.
Looking beyond the numbers
Reporting both nominal and inflation-adjusted results gives a clearer view of retail performance and the company’s profit margins.
4. Not accounting for calendar shifts
Calendar differences can distort comparable sales even when nothing changes operationally.
Watch for:
- 52-week versus 53-week fiscal years
- Holiday timing
- Different trading-day counts
Don’t overlook the calendar
Align reporting periods carefully so you’re comparing the same period under similar trading conditions.
5. Mixing channels without clear attribution
Many retailers now include digital sales in their same-store sales calculation. That’s only reliable if online purchases can be accurately linked to individual store locations.
Otherwise, the same-store sales figure becomes misleading.
Choose one attribution model
Either exclude digital sales or invest in infrastructure that accurately connects every transaction to the right store.
A unified customer and transaction view ensures omnichannel revenue strengthens, rather than distorts, your same-store sales metric.
Once your reporting is accurate, you can use same-store sales to guide smarter investment and operational decisions.
How to go from same-store sales to same-store insights
Calculating same-store sales is only the beginning. The real value comes from understanding what’s driving the number and knowing what to do next.
Same-store sales tell you what happened. Customer data tells you why.
Same-store sales show whether comparable stores are growing or declining. It doesn’t explain why.
Was store sales growth driven by more transactions, larger baskets, or higher purchase frequency? Did loyal customers spend more, or did new customer acquisition improve?
Those answers come from customer-level data linked to store transactions.
Turn performance into insight
When you combine sales data with customer behavior, you gain insight into what’s actually changing. That gives retail managers a stronger foundation for decision-making than relying on a sales figure alone. It’s also the first step toward improving customer lifetime value.
Connect POS data to customer profiles
Linking every transaction to a customer profile transforms same-store sales from a financial metric into a diagnostic tool.
Instead of seeing one revenue number, you can measure:
- Repeat versus new customer revenue
- Loyalty member contribution
- Average items per transaction
- Category performance
This creates a much more comprehensive understanding of individual store performance and customer behavior.
Use same-store insights to drive engagement and loyalty
Once you understand why store performance changed, you can respond appropriately.
- If visit frequency drops among loyalty members, focus on re-engagement.
- If customer traffic declines, prioritize local acquisition.
- If basket size falls, review merchandising or cross-selling opportunities.
Turn insight into action
This is where connected customer data becomes a competitive advantage. A customer loyalty platform helps retailers connect store performance with lifecycle marketing and personalized engagement, turning analysis into more sales instead of just more reporting.
That’s also where platforms like Voyado help retailers move beyond measuring performance to improving it.
How Voyado supports accurate same-store sales measurement
Accurate same-store sales depend on more than the right formula. You need clean transaction data, connected customer data, and the ability to act on what you learn.
1. Create one source of truth: Unify POS and transaction data across every store
Same-store sales is only as accurate as the data behind it.
Voyado’s POS Accelerator connects in-store transactions to customer profiles and brings store data into one platform. Instead of reconciling reports from multiple systems, your team works from one consistent source of truth across every store.
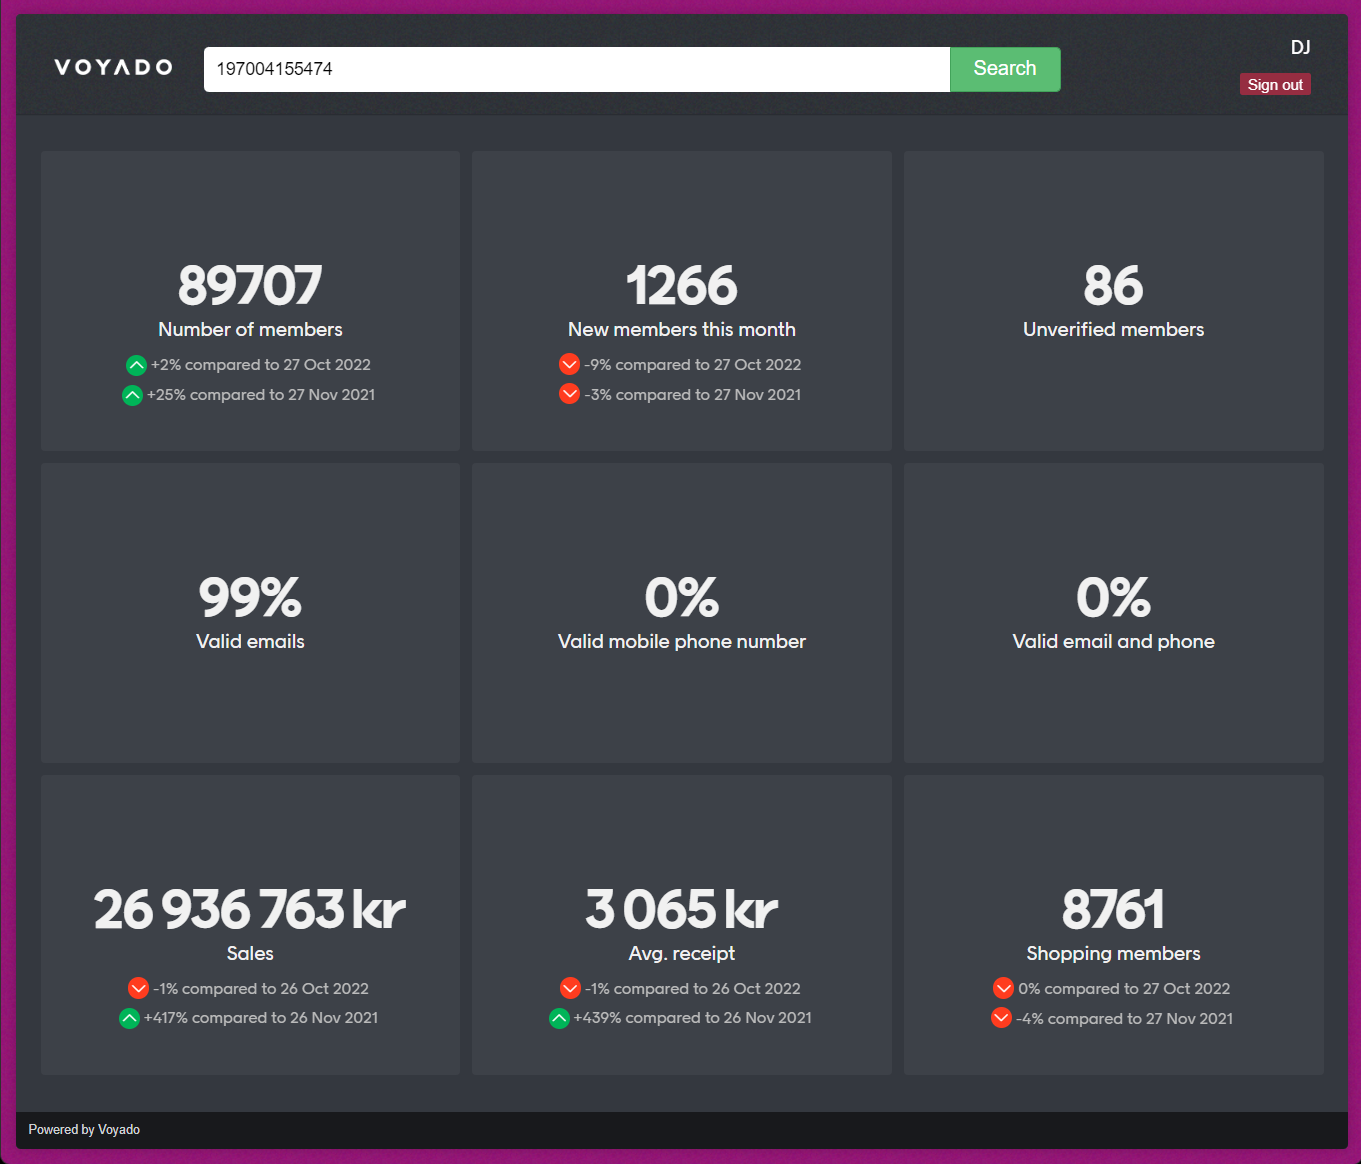
That means more reliable same-store sales data, less manual reporting, and more time to focus on improving performance. Explore more on measuring and using all your retail data.
2. Understand what’s driving performance: Connect POS data to customer profiles
A same-store sales figure tells you what happened. Connected customer data tells you why.
Because every transaction is linked to a customer profile, you can quickly see:
- Loyalty member revenue
- Repeat versus new customer revenue
- Purchase frequency
- Basket composition by store
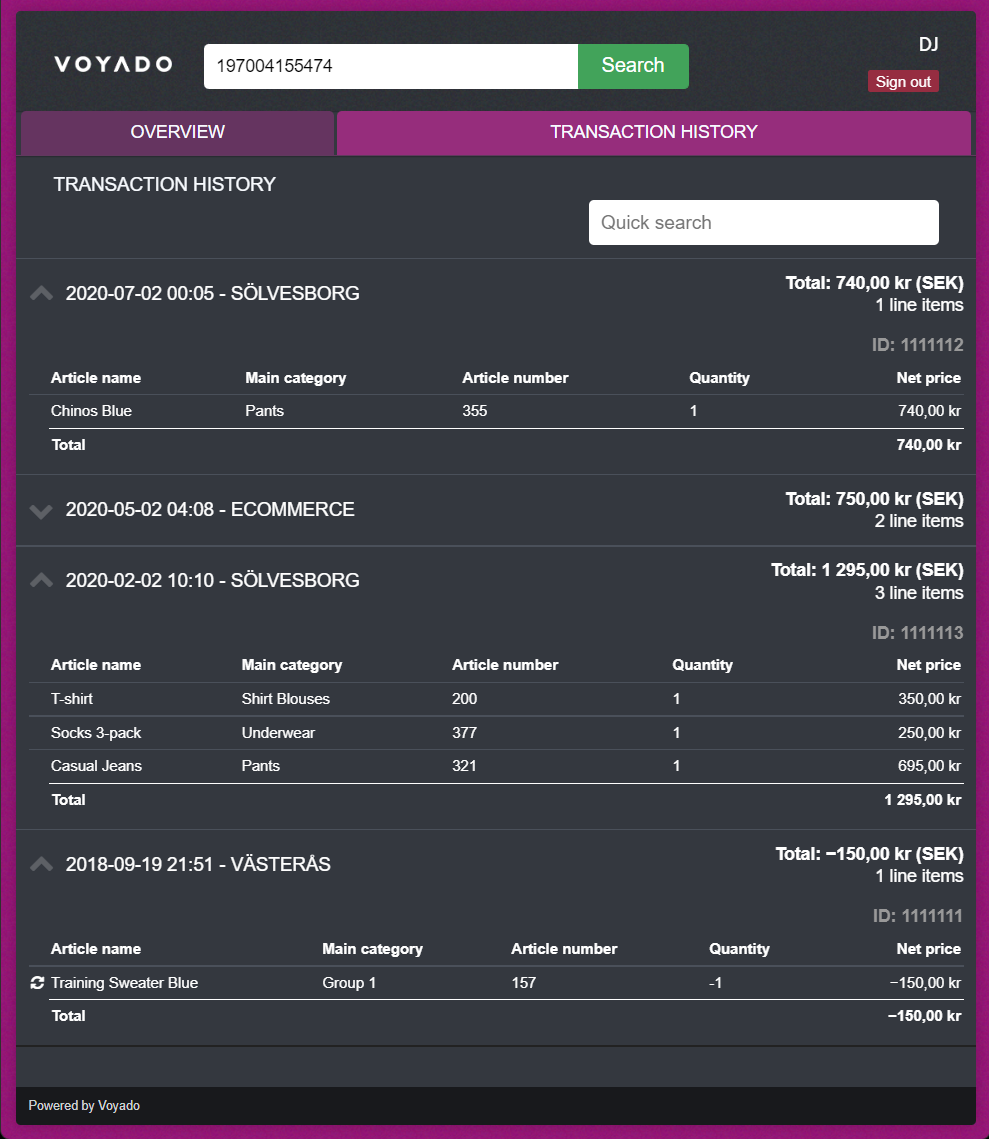
Instead of relying on one sales figure, you understand what’s driving store performance. Combined with retail location analytics, those insights help you prioritize the right stores and the right actions.
3. Turn insights into action: Connect store performance to engagement and loyalty
Finding the cause is only useful if you can respond quickly.
- If loyalty participation falls at a specific store, launch a targeted re-engagement campaign.
- If new customer acquisition slows, run a localized campaign.
- If basket sizes decline, personalize offers based on customer behavior.
Because POS, customer, and loyalty data work together in one platform, your team can move from reporting to action without switching between systems.
But don’t stop at measuring same-store sales.
Book a demo to see how Voyado can help you identify what’s driving store performance and turn those insights into personalized actions that increase revenue.
FAQs
How do you calculate same store sales?
Use the same-store sales calculation: [(Current Period Revenue – Prior Period Revenue) ÷ Prior Period Revenue] × 100. Only include existing stores that have been open for at least a year (or your chosen threshold) and compare the same period year over year.
How do you calculate same-store sales growth?
Same-store sales growth measures the percentage growth in revenue generated by comparable stores between the current period and the same period in the prior year. It uses the same formula as the standard same-store sales calculation.
What is a good same-store sales growth rate?
It depends on the retail industry, market trends, and inflation. Positive same-store sales growth above inflation is generally considered healthy. For mature retail companies, 2-5% is common, while consistently negative results may indicate declining customer traffic or other operational issues.
Should I include online revenue in same-store sales?
You can, but only if digital sales can be accurately attributed to specific store locations. Many retailers report comparable sales that include click-and-collect and ship-from-store, while others keep the same-store sales metric focused on physical stores.
How long should a store be open before it enters the comparable base?
Most retailers require stores to be open for at least a year before including them in comparable stores. Some use 13 or 18 months, but the important part is applying the same rule consistently across all existing locations and reporting periods.
What data do I need for accurate same-store sales?
You need complete POS transaction data, a consistent definition of eligible stores, and reliable sales data across every location. Connecting transactions to customer profiles provides a more comprehensive understanding of what’s driving store performance.
How does Voyado help with same-store sales measurement?
Voyado’s POS Accelerator connects every in-store transaction to customer profiles, creating one source of truth for sales data across your retail chain. That gives you more accurate same-store sales data and helps you gain insight into the customer behavior behind your results, so you can improve future performance instead of simply reporting on it.