TL;DR
- Ecommerce conversion rate optimization (CRO) is the fastest path to revenue growth — 68% of e-commerce leaders named increasing conversion rates their top priority for 2026, according to Voyado’s Inside e-commerce 2026 report.
- The formula is simple: Conversion rate = (Number of conversions ÷ Total visitors) × 100.
- Benchmarks matter: Typical e-commerce conversion rates sit between 2–3%, but top performers reach 5% or higher by systematically removing friction.
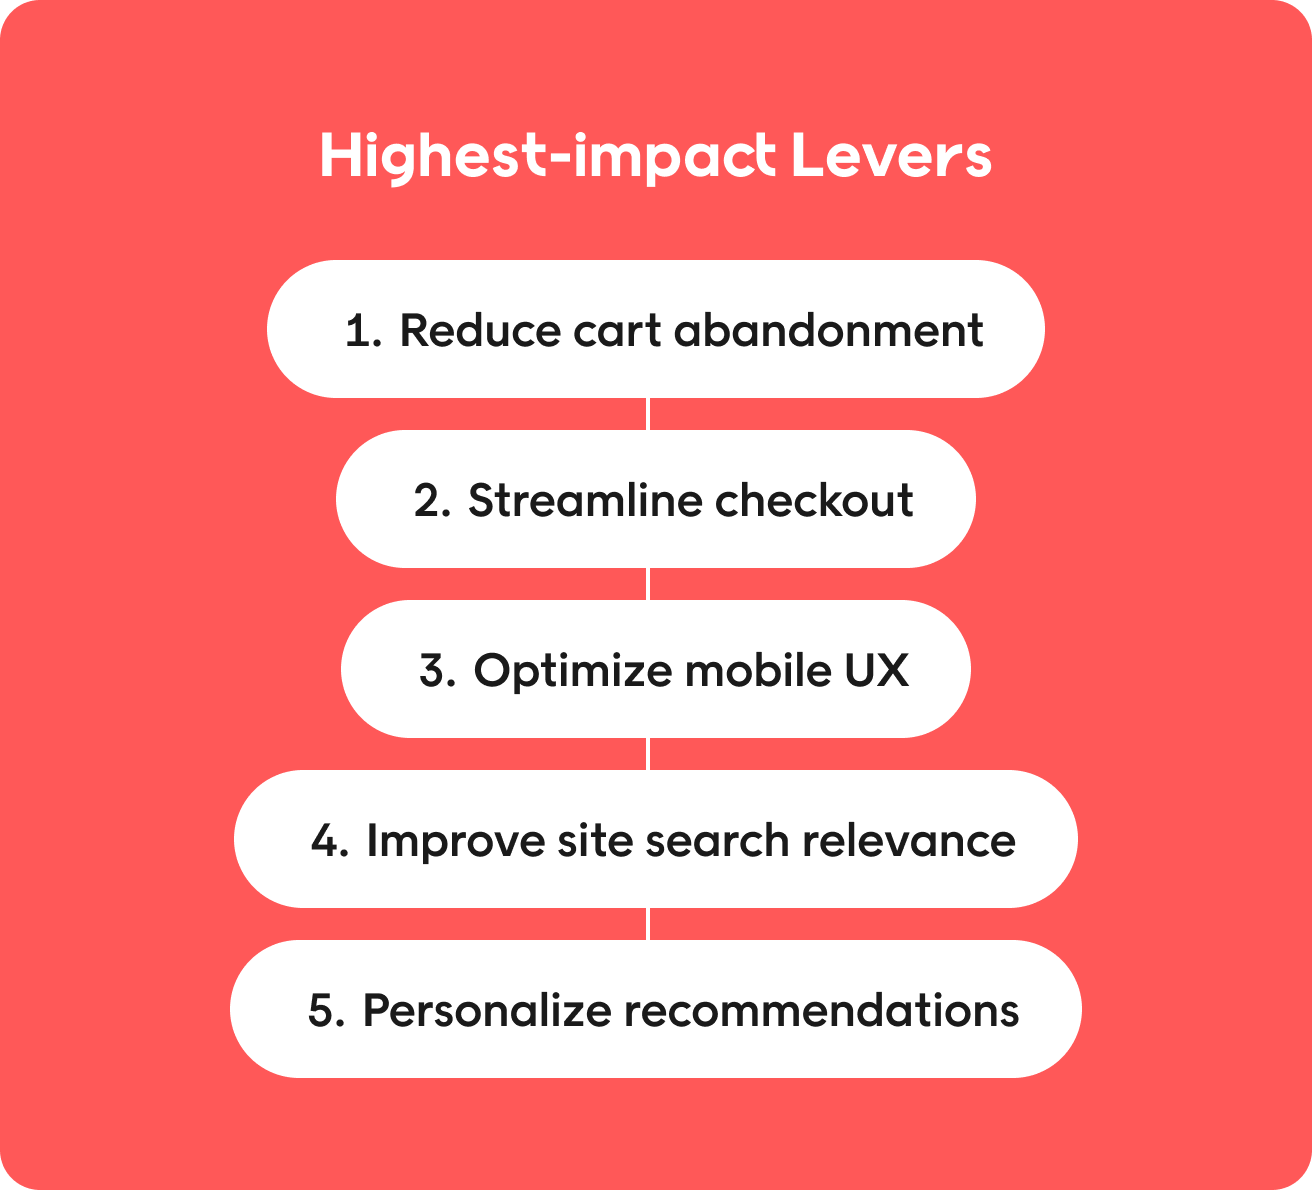
- Highest-impact levers: Cart abandonment reduction, streamlined checkout, mobile UX, site search relevance, and personalized recommendations drive the biggest gains.
- CRO compounds: Improving conversion rate by 1 percentage point on 100,000 monthly visitors means 1,000 more orders — without spending more on acquisition.
Growth in 2026 isn’t coming from chasing new shoppers. It’s coming from getting more value from the traffic you already have. Ecommerce conversion rate optimization is how you do it — and the data proves the industry knows this. Voyado’s Inside e-commerce 2026 report surveyed 50 e-commerce leaders and found that improving conversion rates outranked both growing AOV (44%) and scaling personalization (42%) as the number-one priority.
This guide gives you a practical CRO framework: what conversion rate actually measures, how to calculate it, realistic benchmarks, and the high-impact levers that move the needle. You’ll also get a testing methodology to make CRO systematic rather than ad hoc.
What is ecommerce conversion rate optimization?
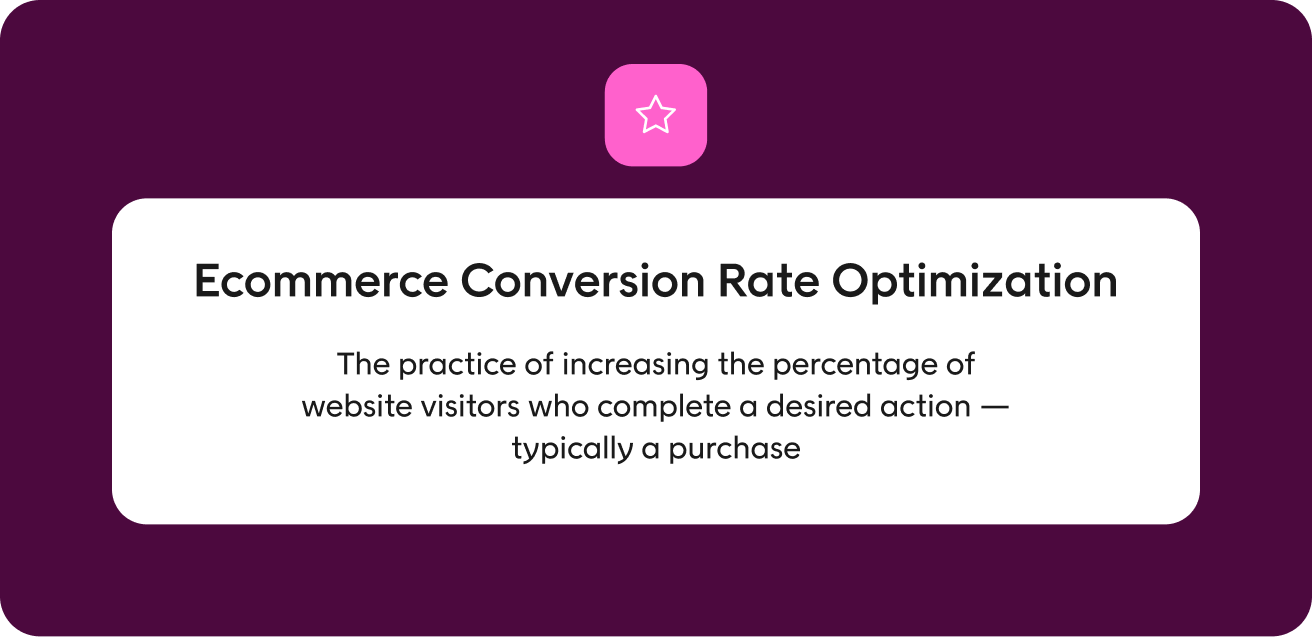
Ecommerce conversion rate optimization is the practice of increasing the percentage of website visitors who complete a desired action — typically a purchase. CRO focuses on removing friction, improving the user experience, and presenting the right products at the right moment to convert browsers into buyers.
Unlike acquisition-focused marketing, CRO doesn’t require you to spend more to drive more traffic. It maximizes the value of every session you already pay for. That’s why conversion rate optimization delivers compounding returns: a 10% lift in conversion rate on steady traffic equals a 10% lift in revenue — permanently.
How to calculate ecommerce conversion rate
The conversion rate formula is straightforward:
Conversion rate (%) = (Total conversions ÷ Total visitors) × 100
For example: If your site receives 50,000 visitors in a month and 1,250 complete a purchase, your conversion rate is:
(1,250 ÷ 50,000) × 100 = 2.5%
You can calculate conversion rates at multiple levels:
- Site-wide: All orders ÷ all visitors
- Traffic source: Conversions from paid search ÷ paid search visitors
- Device type: Mobile conversions ÷ mobile visitors
- Product category: Category orders ÷ category page visitors
Breaking down conversion rate by segment reveals where you’re losing the most revenue — and where to focus optimization efforts.
What is a good ecommerce conversion rate?
The average ecommerce conversion rate typically falls between 2% and 3%, though this varies by industry, device type, and traffic quality. Desktop conversion rates tend to run higher than mobile (often 3–4% versus 1.5–2.5%), and returning visitors convert at higher rates than new visitors.
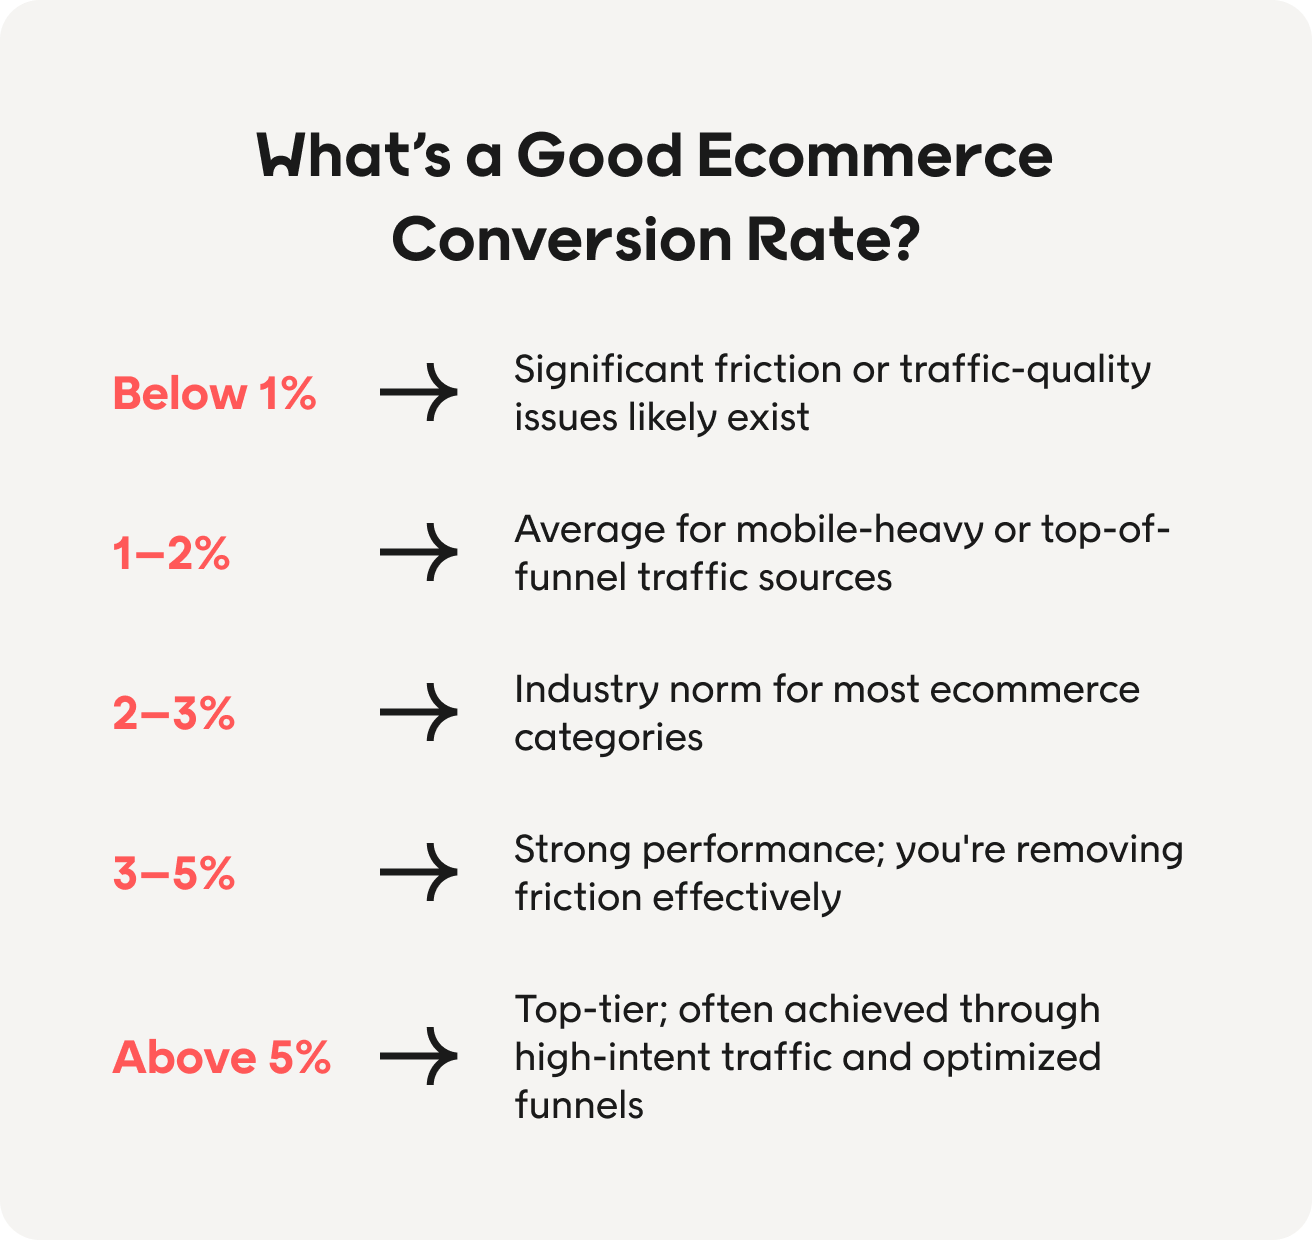
Here’s what the benchmarks tell you:
- Below 1%: Significant friction or traffic-quality issues likely exist.
- 1–2%: Average for mobile-heavy or top-of-funnel traffic sources.
- 2–3%: Industry norm for most ecommerce categories.
- 3–5%: Strong performance; you’re removing friction effectively.
- Above 5%: Top-tier; often achieved through high-intent traffic and optimized funnels.
The point of benchmarks isn’t to feel good or bad about your number. It’s to identify whether your conversion rate indicates systemic problems that need structural fixes or incremental optimizations that need testing.

Why e-commerce conversion rate optimization is the 2026 priority
The math is simple: acquiring new traffic keeps getting more expensive, while improving conversion from existing traffic costs relatively little. Voyado’s Inside E-commerce 2026 report confirms that the industry has caught on, conversion rate optimization is now the top focus for the majority of e-commerce leaders. When asked to name their top priority for the year ahead, one respondent put it plainly: “Improving website conversion rate, as we have grown traffic,” says Anjuli, Digital Marketing and E-commerce Manager. That’s the position a lot of teams are in. Acquisition worked, and now the funnel is the bottleneck.
The report also surfaced which discovery features leaders believe have the biggest impact on sales:
- Personalized recommendations: 28% of leaders rated this the highest-impact feature.
- Strong search result relevance: 26% called out site search as a key conversion driver.
These features help shoppers find what they want faster — a direct path to higher conversion. When you combine discovery optimization with checkout improvements and mobile UX fixes, you compound the effect.
The ROI case for CRO over acquisition
Consider a store with 100,000 monthly visitors, a 2% conversion rate, and an average order value of $75. That’s:
- 100,000 × 2% = 2,000 orders
- 2,000 × $75 = $150,000 monthly revenue
Now, what happens if you increase the conversion rate from 2% to 2.5% — a 0.5 percentage point lift?
- 100,000 × 2.5% = 2,500 orders
- 2,500 × $75 = $187,500 monthly revenue
That’s $37,500 in additional monthly revenue without increasing traffic spend. Annualized, it’s $450,000. Compared with acquiring 500 more customers per month through paid channels, CRO delivers higher margins and permanent gains.
The ecommerce conversion rate optimization framework
Effective CRO isn’t random testing. It requires a structured approach: diagnose, hypothesize, test, and iterate. Here’s how to build a systematic framework.
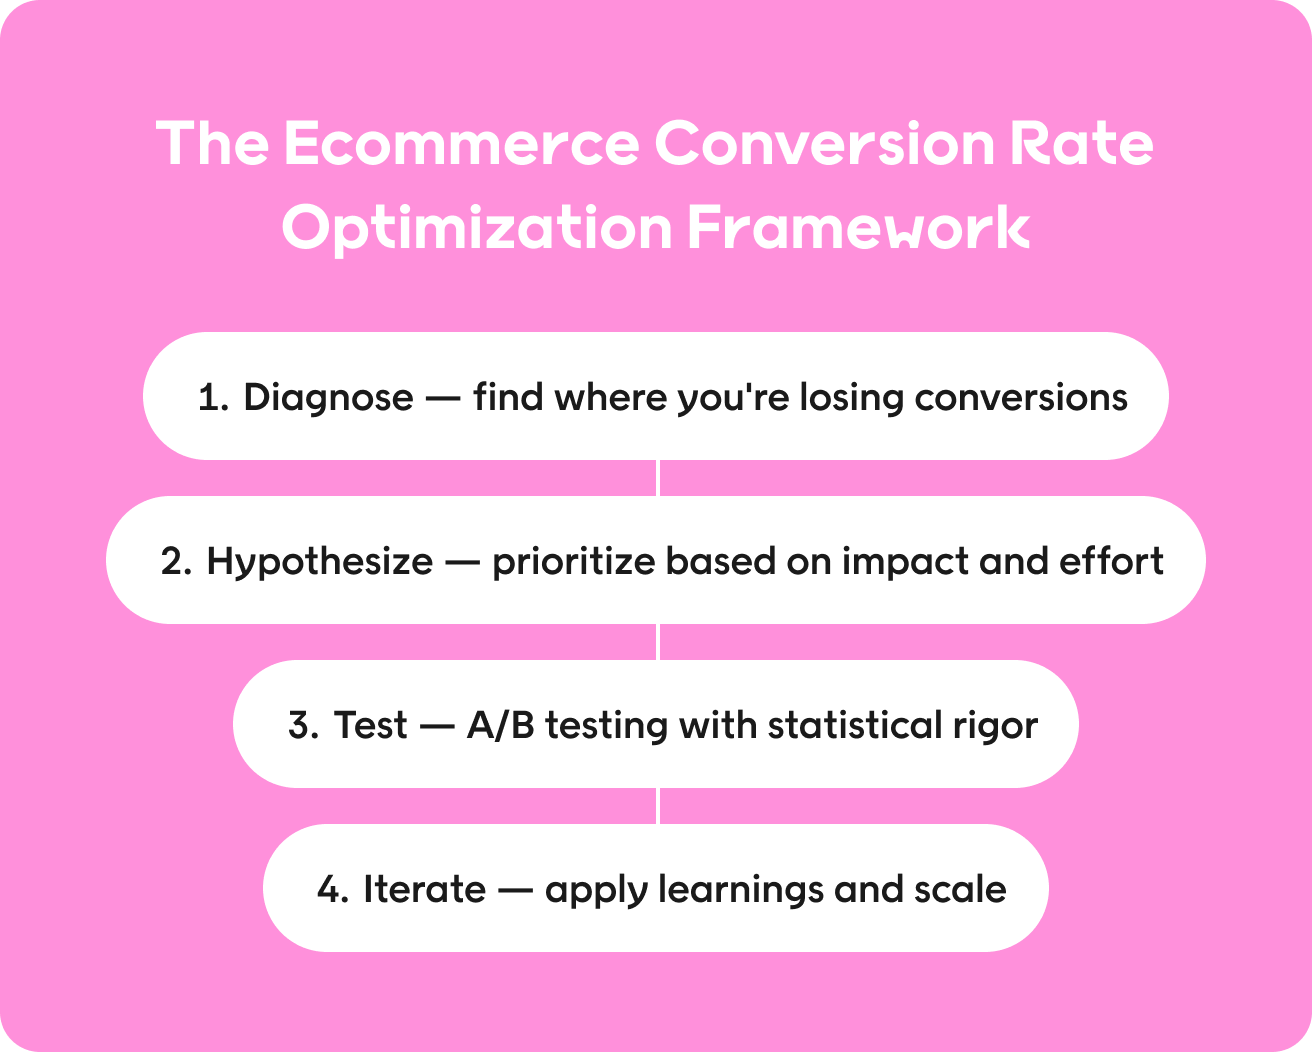
Step 1: Diagnose — find where you’re losing conversions
Start with quantitative analysis. Look at:
- Funnel drop-off rates: Where do visitors abandon? Product pages? Cart? Checkout?
- Device split: Is mobile conversion significantly lower than desktop?
- Traffic source performance: Which channels deliver high traffic but low conversion?
- Page-level bounce rates: Which pages lose visitors immediately?
Then add qualitative data: heatmaps, session recordings, customer feedback, and exit surveys. Quantitative data shows where; qualitative data shows why.
Step 2: Hypothesize — prioritize based on impact and effort
Not every friction point deserves equal attention. Prioritize hypotheses using the ICE framework:
- Impact: How much will fixing this move the needle on conversion?
- Confidence: How sure are you this will work?
- Ease: How fast and cheap can you implement and test it?
Score each hypothesis 1–10 on each criterion, multiply the scores, and rank. Start with high-impact, high-confidence, low-effort tests.
Step 3: Test — A/B testing with statistical rigor
Run controlled experiments. Show version A (control) to half your traffic and version B (variant) to the other half. Measure the conversion rate difference.
Key testing requirements:
- Sample size: Don’t call a test early. Use a sample size calculator to determine how many visitors you need for statistical validity — typically hundreds or thousands per variant.
- Statistical significance: Aim for 95% confidence before declaring a winner. A test that’s 80% confident might flip with more data.
- Test duration: Run tests for at least one full business cycle (typically 1–2 weeks minimum) to account for day-of-week and traffic mix variations.
Step 4: Iterate — apply learnings and scale
When you find a winner, implement it site-wide and move to the next hypothesis. Document results — both wins and losses. Failed tests still generate insight about what doesn’t move your audience.
CRO is ongoing. Each improvement creates a new baseline; the next test builds on it.
Highest-impact levers for ecommerce conversion rate optimization
E-commerce leaders in Voyado’s 2026 survey consistently pointed to several conversion levers: simpler navigation, faster checkout, better mobile UX, and more relevant search and recommendations. Here’s how to apply each.
Reduce cart abandonment
Cart abandonment rates in ecommerce often exceed 70%. The top reasons shoppers abandon:
- Unexpected costs (shipping, taxes, fees)
- Complicated checkout process
- Forced account creation
- Concerns about payment security
Fixes that work:
- Show total costs (including shipping) early — on product pages or in the cart.
- Offer guest checkout with optional account creation after purchase.
- Reduce checkout to as few steps and fields as possible.
- Display trust signals: SSL badges, payment logos, return policy guarantees.
Streamline checkout
Checkout is the final conversion bottleneck. Every additional step, field, or click loses shoppers.
Practical changes:
- Use single-page checkout or a clear progress indicator.
- Auto-fill address fields using postal code lookups.
- Offer multiple payment methods (credit, debit, Apple Pay, Google Pay, buy-now-pay-later).
- Enable saved payment methods and addresses for returning customers.
- Remove distractions: navigation, headers, and footers can wait until confirmation.
Optimize mobile UX
Mobile traffic often accounts for 60% or more of ecommerce sessions, yet mobile conversion rates lag desktop by 40–50%. Closing this gap is a high-leverage opportunity.
Focus areas:
- Tap targets sized for fingers, not mouse pointers — at least 48px.
- Form fields that trigger the right keyboard (numeric for phone, email for email).
- Fast load times: every second of delay reduces conversion by approximately 7%.
- Sticky add-to-cart and checkout buttons so they’re always accessible.
- Simplified navigation with fewer menu levels.
Improve site search relevance
E-commerce leaders rated search result relevance as one of the top two discovery features impacting sales. Visitors who use site search convert at 2–3x the rate of non-search visitors — but only if they find what they want.
What good looks like:
- Search that handles misspellings, synonyms, and partial matches.
- Results ranked by relevance plus commercial signals (margin, stock, popularity).
- Filters that adapt to the category (color for apparel, size for shoes, material for furniture).
- “No results” pages that suggest alternatives rather than dead-ending.
Personalize recommendations
According to Voyado’s Inside E-commerce 2026 report, 28% of leaders said personalized recommendations have the biggest impact on sales — the highest-rated discovery feature.
Recommendation placements that drive conversion:
- Product detail pages: “You might also like” or “Customers also bought.”
- Cart page: Complementary products or higher-tier alternatives.
- Homepage: Personalized picks based on browsing history.
- Email and SMS: Abandoned cart reminders with the exact products left behind.
Recommendations work because they reduce the effort to find the next right product. When personalization is data-driven — based on real behavioral signals, not generic rules — conversion lifts follow.
Tying CRO to AOV and revenue per shopper
Conversion rate optimization doesn’t happen in isolation. AOV (average order value) and conversion rate together determine revenue per visitor.
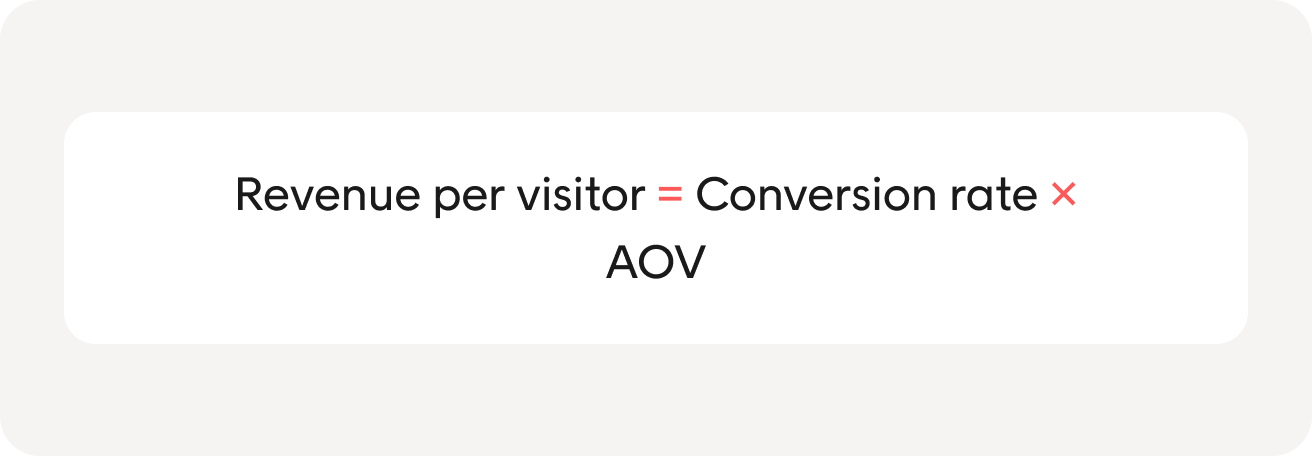
Revenue per visitor = Conversion rate × AOV
A 2.5% conversion rate with a $75 AOV yields $1.88 revenue per visitor. Lift conversion to 3% with the same AOV, and revenue per visitor rises to $2.25 — a 20% improvement.
Now layer in AOV optimization (upsells, cross-sells, bundle offers, free-shipping thresholds) and the gains compound. CRO and AOV strategies reinforce each other: easier discovery and checkout increase conversion, while strategic recommendations increase basket size.
This is where a unified approach matters. When customer data, product discovery, and checkout experience work together across touchpoints, you don’t optimize in silos — you optimize the full journey.
Checklist: How to increase ecommerce conversion rate
- Audit your funnel: Identify the steps with the highest drop-off.
- Prioritize by ICE: Focus on high-impact, high-confidence, low-effort fixes first.
- Simplify checkout: Reduce steps, fields, and friction.
- Fix mobile UX: Close the desktop-mobile conversion gap.
- Improve search: Ensure searchers find relevant results, fast.
- Personalize recommendations: Use behavioral data to surface the right products.
- Test with rigor: Require sample size and statistical significance before calling winners.
- Iterate continuously: CRO is a program, not a project.
Conclusion
Ecommerce conversion rate optimization is no longer optional — it’s the primary growth lever for 2026 and beyond. With 68% of e-commerce leaders prioritizing conversion rate above all else, the industry consensus is clear: getting more from existing traffic beats chasing more traffic.
The formula is simple. The framework is repeatable. And the highest-impact levers — cart abandonment, checkout, mobile UX, search relevance, and personalized recommendations — are well understood.
The question isn’t whether to invest in CRO. It’s how fast you can build a systematic testing program and start compounding gains. Every percentage point you add to conversion goes directly to revenue — without adding a dollar to your acquisition budget.
FAQs
What is conversion rate optimization in ecommerce
Ecommerce conversion rate optimization is the systematic process of increasing the percentage of website visitors who complete a purchase. It involves identifying friction points in the customer journey — such as confusing navigation, slow checkout, or irrelevant search results — and testing changes to remove those barriers and improve conversion.
What is a good ecommerce conversion rate?
A typical ecommerce conversion rate falls between 2% and 3%. Rates above 3% indicate strong performance, while rates above 5% are top-tier. Benchmarks vary by device type, industry, and traffic source — mobile rates tend to be lower than desktop, and returning visitors convert at higher rates than new visitors.
How do you calculate ecommerce conversion rate?
Calculate conversion rate using this formula: (Total conversions ÷ Total visitors) × 100. For example, 1,500 orders from 60,000 visitors equals a 2.5% conversion rate. You can calculate at the site level, by traffic source, by device, or by product category to identify optimization opportunities.
How can I improve my ecommerce conversion rate?
Focus on the highest-impact levers: reduce cart abandonment by eliminating surprise costs and checkout friction, optimize mobile UX for faster load times and easier navigation, improve site search relevance so shoppers find products quickly, and add personalized recommendations to surface the right products at the right moment.
What factors affect ecommerce conversion rate?
Key factors include page load speed, checkout complexity, mobile usability, site search quality, personalization, trust signals, and product discoverability. Traffic quality also matters — visitors from high-intent sources (branded search, email) convert at higher rates than top-of-funnel traffic (social, display).
About Author